
• Why Exporters Lose Money Even After Getting Paid

    Exporters lose money after getting paid due to four silent leaks: SWIFT intermediary deductions, FX spread applied at conversion, settlement float cost (days your money sits idle), and reconciliation inefficiency. On a USD 25,000/month business, these combined losses can exceed USD 600–900 per month — or roughly 2.5–3.5% of revenue — without a single line item on your bank statement explaining why.

    You Invoiced. You Got Paid. So Why Does Something Feel Off?

    Most exporters have been there. The payment shows as received. The USD amount matches the invoice. You tell your team it’s cleared. Then the INR credit hits your account — and the number is slightly lower than you expected. Not dramatically. Just enough to make you check the rate, shrug, and move on.
    That shrug is costing you money every single month.
    The problem isn’t that export payments are unreliable. The problem is that the gap between what your buyer sends and what you actually receive is built into the infrastructure — invisibly, across multiple points in the chain. And because it never appears as a single line item, most businesses never see it, let alone fix it.
    If you’re collecting USD 25,000 or more per month, this is not a rounding error. This is a meaningful portion of your realized revenue that never materializes.

    The Four Points Where Exporters Lose Money

    1. SWIFT Intermediary Deductions 

    When your buyer sends a SWIFT wire from their US bank, that transfer doesn’t travel directly to your Indian account. It passes through one, sometimes two, correspondent banks in between. Each of those correspondents may deduct a processing fee — typically USD 15 to USD 45 per transaction. 

    This depends on whether the transfer was sent as OUR (buyer bears all charges), SHA (charges split), or BEN (you bear all charges). Most buyers default to SHA without thinking about it. Many exporters never check which code is being used. 

    On ten transactions a month at SHA, you could be absorbing USD 150 to USD 250 in deductions that you never billed for and never agreed to. 

    2. FX Spread at Conversion 

    When your USD lands in the banking system, it needs to be converted to INR. The rate applied to your conversion is not the market rate you see on Google or Bloomberg. It is the rate your bank has decided to offer you — which includes a spread above or below the interbank rate. 

    For SME exporters, this spread typically ranges from 0.5% to 2%, sometimes higher. On USD 25,000, a 1.5% spread means your bank pockets approximately USD 375 per month from this conversion alone. 

    This is not disclosed as a charge. It does not appear on your statement as a fee. It simply reduces the INR you receive — and because the market rate fluctuates, it is nearly impossible to notice without actively tracking it. 

    3. Settlement Float Cost 

    SWIFT payments typically take two to five business days to settle. During that time, your money is sitting somewhere in the correspondent banking chain — not earning returns, not available to your business. 

    For businesses managing working capital tightly, delayed settlement creates a real cost. If you’re borrowing against receivables or managing vendor payment cycles, every day of settlement delay has a measurable operational cost. 

    For a business collecting USD 300,000 annually, even a two-day settlement delay across all transactions represents meaningful float cost in working capital terms. 

    4. Reconciliation Inefficiency 

    This one doesn’t show up as a financial loss directly — but it compounds the others. When payments arrive without consistent references, or when SWIFT deductions change the amount received versus the amount invoiced, your finance team spends time matching, investigating, and correcting. 

    That’s staff cost. It’s also delayed reconciliation, which delays tax compliance, FEMA documentation, and BRC filing timelines. 

    What This Looks Like at USD 25,000 Per Month 

    Loss CategoryTypical Range Monthly Impact (USD 25k) Visibility on Statement
    SWIFT intermediary deductions USD 15–45 per txn USD 150–300 Not itemized 
    FX spread at conversion 0.5%–2.0% USD 125–500 Not disclosed 
    Settlement float opportunity cost 2–5 days per payment Indirect Not shown 
    Reconciliation labor cost Variable Staff time Not shown 
    TOTAL ESTIMATED LOSS ~2%–3.5% of collections USD 275–800 Invisible 

    At the lower end of this range, that’s USD 3,300 a year you’re not collecting. At the higher end, it’s nearly USD 10,000 annually. And this is for a business at just the USD 25k/month threshold. 

    Why Finance Teams Rarely Catch This 

    It’s not because your finance team isn’t doing its job. It’s because the traditional export payment workflow was never designed for this level of visibility. 

    Your bank statement shows INR received. It does not show INR you should have received. There is no variance report. There is no FX attribution. There is no intermediary deduction log. You would have to manually reconstruct the transaction chain from multiple sources to see the complete picture — and almost nobody does that for every payment. 

    This is exactly why realized revenue tracking has become a core treasury function for sophisticated exporter businesses. It’s the discipline of measuring not just what came in, but what should have come in. 

    What You Can Actually Do 

    The good news is that this problem is solvable — not completely, but substantially. 

    • Switch to local collection accounts for USD, EUR, GBP, and CAD collections. When your buyer pays locally (like a domestic bank transfer), correspondent banking deductions largely disappear. Your payment arrives clean, with full amounts, faster. 
    • Benchmark your FX rate on every conversion. Ask your bank for the rate applied and compare it against the interbank rate for that day. The gap is your cost. Tracking it consistently creates accountability and gives you data to negotiate. 
    • Track realized revenue per transaction, not just total INR received. The question isn’t just ‘how much INR did I get’ but ‘what was the effective USD equivalent I received after all costs.’ This number is your real revenue. 
    • Choose infrastructure that shows you FX rates before conversion, not after. Transparency at the point of conversion is a structural advantage. If you can see the rate and decide timing, you retain control over a significant revenue variable. 
    • Consolidate payment references. Ensure every international payment has a consistent invoice reference. It reduces reconciliation cost and makes FEMA documentation significantly cleaner. 

    The Bigger Picture 

    International payments are not just an operational function for exporters. They are a revenue function. The difference between what your buyer sends and what reaches your INR account represents the effective monetization rate of your export business. 

    For businesses at USD 25k to USD 500k per month in collections, even a 1% improvement in that monetization rate is material. It’s the equivalent of finding a hidden revenue stream that required no new sales, no new clients, and no new product. 

    The businesses that grow their export operations most efficiently are increasingly the ones that treat payment infrastructure as a strategic decision — not just an operational one. 

    Frequently Asked Questions 

    Why do exporters lose money even when the buyer pays the full invoice amount? 

    The full invoice amount rarely reaches the exporter intact. SWIFT intermediary fees are deducted en route, the FX spread at conversion reduces INR received, and settlement delays affect working capital. None of these appear as a single visible charge. 

    What is FX spread and how does it affect export payments? 

    FX spread is the difference between the live interbank exchange rate and the rate your bank applies when converting your foreign currency to INR. A 1.5% spread on USD 25,000 means you receive the equivalent of USD 375 less — every single month. 

    What is the difference between invoice revenue and realized revenue? 

    Invoice revenue is what you billed your buyer. Realized revenue is what actually reaches your INR account after SWIFT deductions, FX spread, and other costs. The gap between these two numbers is where your money silently disappears. 

    What are SWIFT intermediary deductions? 

    When a payment travels via SWIFT, it passes through correspondent banks that each charge a processing fee. These deductions are made from your payment amount, not separately billed. They depend on the charge code (OUR/SHA/BEN) used at the time of transfer. 

    How can exporters reduce losses on international payments? 

    The most effective approach is a combination of local collection accounts (to eliminate correspondent deductions), transparent FX pricing infrastructure, and realized revenue tracking at the transaction level. Each reduces a specific leak. 

    Is there a way to calculate how much I’m losing on international payments? 

    Yes. For every transaction, compare the INR received against the INR you would have received at the interbank rate that day, with no intermediary deductions. The difference, tracked consistently over a quarter, shows your total payment leakage. 

    Do local collection accounts solve all these problems? 

    Local collection accounts eliminate or significantly reduce SWIFT intermediary deductions and improve settlement predictability. FX optimization depends additionally on the pricing infrastructure of your provider. Combined, the two significantly improve realized revenue.

    Complete Guide to Receiving Export Payments in India

  • How Banks Make Money on FX (And What It Costs Your Business) 

    Banks earn on FX through a mechanism most businesses never see on their statement. Here’s exactly how it works, what it costs exporters doing USD 25k+ per month, and how to benchmark it.

    There’s No Line Item. That’s the Point. 

    If your bank charged you a flat fee every time they converted your USD to INR, you’d notice it immediately. You’d probably negotiate it. You might even switch providers. 

    Banks don’t do that. They don’t need to. 

    Instead, they apply a rate. The rate they show you is not the real market rate. It’s the market rate, plus a margin they’ve decided to earn. The difference is invisible unless you’re actively

    looking for it — and because no regulatory requirement forces banks to disclose this margin as a named fee, most businesses never look. 

    This is not a conspiracy. It’s how FX has worked for decades in traditional banking. But it’s worth understanding precisely, because for exporters with meaningful USD collections, it’s one of the larger silent costs in their P&L.

    How the FX Market Actually Works 

    There is a live, global interbank FX market operating 24 hours a day. At any given moment, USD/INR has a rate — let’s call it the mid-market rate. This is what you see on Google, Bloomberg, Reuters, or XE.com. Banks trade with each other at or very close to this rate. 

    When you, as an exporter, receive USD and ask your bank to convert it to INR, you don’t get the mid-market rate. You get a rate the bank sets — and that rate is less favorable to you than the market rate. The difference between what the bank pays in the interbank market and what they give you is the bank’s margin on the transaction. It’s called the FX spread. 

    The bank earns this margin without taking on risk (they immediately hedge or pass through in the interbank market). It’s pure service revenue, earned on every conversion, disclosed to nobody. 

    What Does This Look Like in Practice? 

    Say the USD/INR interbank rate is 93.50 at the time your payment is converted. 

    Your bank applies a 1.5% spread. They quote you 92.0975 instead. 

    On USD 25,000, the difference is: 

    • At 93.50: you receive INR 23,37,500 
    • At 93.0975: you receive INR 23,02,437 
    • Difference: INR 35,062 — or approximately USD 375 — lost silently 

    That number doesn’t appear anywhere on your bank statement. Your statement says your USD was converted at 82.25. It doesn’t say the market was at 83.50. It doesn’t say the difference was INR 31,250. It simply shows you the INR credit, and you have no immediate way to know whether that rate was fair. 

    How Spread Varies by Relationship and Volume 

    FX spread is not fixed. It varies based on your relationship with the bank, your transaction volume, whether you’ve negotiated a rate, and increasingly, what kind of infrastructure you’re using. 

    Client Type Typical FX Spread On USD 25k/MonthAnnual Impact
    Large corporate (negotiated) 0.2%–0.5% USD 50–125 USD 600–1,500 
    Mid-market exporter 0.8%–1.5% USD 200–375 USD 2,400–4,500 
    SME exporter (standard) 1.5%–2.5% USD 375–625 USD 4,500–7,500 
    No rate negotiation 2.0%–3.0%+ USD 500–750+ USD 6,000–9,000+ 

    Most Indian exporters in the USD 25k–200k/month range are operating at SME or mid-market spreads. They’ve never negotiated because they didn’t realize there was anything to negotiate, or because they assumed the bank’s rate was standard. 

    It’s not. Everything in FX is negotiable at sufficient volume. 

    Why This Is Harder to See Than Any Other Cost 

    Consider how your other business costs work. Your rent is on a lease. Your payroll is itemized. Your software subscriptions have invoices. Your logistics vendor sends you a rate card. Every cost has a document. 

    FX spread has none of that. The only record is the conversion rate on your statement. And because currency rates fluctuate daily, any single data point looks reasonable in isolation. It’s only when you track your actual realized rate versus the market rate, systematically, over time, that the pattern becomes visible. 

    This is why we consistently see finance teams at growing exporter businesses describe FX as a cost they always felt was probably too high — but never had the data to act on. 

    Traditional Bank FX vs Modern FX Infrastructure 

    Traditional Bank FX Modern FX Infrastructure 
    Rate transparency Rate disclosed at conversion only Live rate shown before conversion 
    Spread disclosure Not disclosed, not itemized Spread stated explicitly 
    Benchmarking Not possible without manual work Built-in market rate comparison 
    Timing control Bank decides conversion timing Exporter controls conversion timing 
    Treasury visibility INR received, no attribution Full FX attribution per transaction 
    Volume advantage Only for large corporates Available at SME scale 

    What Exporters Should Do 

    The first step is measurement. You cannot optimize what you do not measure. For every USD conversion, record: 

    • The date of conversion 
    • The USD amount converted 
    • The rate your bank applied 
    • The mid-market rate on that date (from any public source) 
    • The spread in percentage terms 

    Do this for three months. The data will tell you exactly how much you’re paying in FX margin annually. For most SME exporters, it’s a number large enough to justify a change. 

    The second step is choosing infrastructure that shows you the rate before conversion, not after. When you can see what you’re getting before you commit to it, you make better decisions. You can time conversions. You can benchmark. You can negotiate. 

    The third step — for businesses at sufficient volume — is having a conversation with your bank about FX terms. Volume is leverage. Most exporters don’t realize they have it. 

    The Strategic Framing 

    FX is a revenue function, not an accounting function. The margin your bank earns on every conversion is margin that would otherwise be yours. It’s not a cost of doing business in the way that logistics is a cost. It’s the difference between the value your business created and the value your business actually captured. 

    For a business doing USD 300,000 in annual collections, optimizing FX by even 1% is USD 3,000 in additional realized revenue — with no new clients, no new product, and no new overhead. That’s the business case for treating FX transparency as a priority. 

    Frequently Asked Questions 

    How do banks make money on FX transactions? 

    Banks earn through the FX spread — the difference between the live interbank market rate and the rate they quote customers. This margin is not disclosed as a fee. It reduces the INR received without appearing as a line item on the statement. 

    What is FX spread for Indian exporters? 

    For Indian SME exporters, FX spread typically ranges from 1.5% to 2.5% with standard banking relationships. Large corporates may negotiate this down to 0.2%–0.5%. The spread is applied at the point of USD to INR conversion. 

    Is FX margin the same as forex charges? 

    Not exactly. Forex charges are explicit fees (like SWIFT charges or transfer fees). FX margin is implicit — it’s built into the conversion rate rather than charged separately. Both reduce your realized revenue, but FX margin is harder to see. 

    Can exporters negotiate FX rates with banks? 

    Yes. FX rates are negotiable, particularly at higher transaction volumes. Most SME exporters have never negotiated because they weren’t aware the spread was variable. Building a data case — showing your volume, frequency, and current realized rate — strengthens any negotiation. 

    How can I find out what FX spread my bank is charging? 

    Compare the rate applied on your bank statement with the mid-market rate on the same date (available on any public FX data source). The percentage difference is your spread. Do this consistently for three months to build an accurate picture. 

    Does using local collection accounts reduce FX costs? 

    Local collection accounts primarily reduce SWIFT intermediary deductions. FX spread at conversion depends on the pricing infrastructure of your payment provider. Providers using live interbank pricing with transparent spread disclosure give you better visibility and typically better effective rates than traditional banking. 

    What is the mid-market rate? 

    The mid-market rate is the midpoint between the buy and sell prices in the interbank FX market — the rate banks use when trading with each other. It’s the most accurate reflection of currency value at any given moment. Consumer and business rates are always less favorable than the mid-market rate. 

    Complete Guide to FX Optimization for Exporters

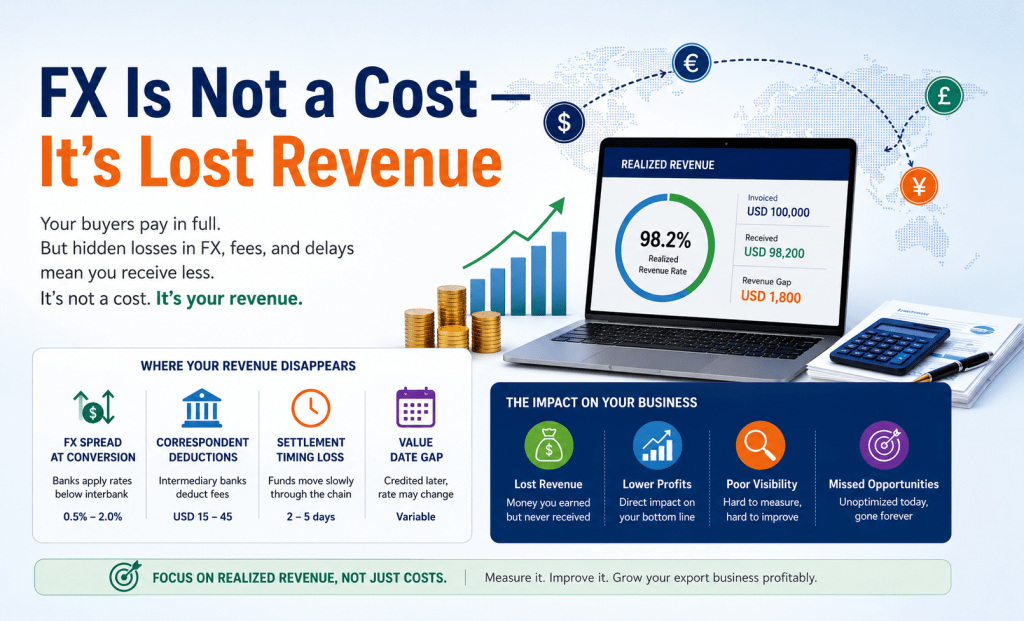
  • FX Is Not a Cost — It’s Lost Revenue 

    Classifying FX losses as an operating cost is a structural mistake that hides the real problem. FX losses are not costs you incur — they are revenue you earned but never received. The distinction changes everything: who owns the problem, how you measure it, what you optimize, and ultimately, how profitable your export business actually is.

    The Label Is Wrong, and It’s Costing You 

    Open any P&L statement for an Indian exporter and you’ll find a line called ‘Forex Loss’ somewhere in operating expenses. It sits alongside things like rent, salaries, and vendor payments. It gets treated as a cost of doing business — something to minimize where possible, but ultimately accepted as a feature of international trade. 

    That framing is wrong. And it’s worth examining carefully, because the label you use for a problem determines how seriously you take it, who you hold accountable, and what actions you’re willing to invest in to fix it. 

    Rent is a cost. You negotiate the lease, you sign it, you pay it. It’s a resource consumed in exchange for a service. 

    Salaries are a cost. People work, you compensate them. Fair exchange. 

    FX loss is different. You created value — you exported a service or good, you invoiced your buyer, your buyer paid you. The revenue was yours. Then, somewhere in the process of getting that money from their bank account to yours, a portion of it simply didn’t arrive. You didn’t spend it. You didn’t exchange it for something. It evaporated. 

    That’s not a cost. That’s lost revenue. 

    Why the Distinction Actually Matters 

    You might be thinking: isn’t this just semantics? Either way, the money is gone. 

    It’s not semantics. Here’s why the framing matters practically. 

    1. Ownership Changes 

    When FX is classified as a cost, it’s owned by the finance team as an accounting matter. It sits in the books. Someone reconciles it. Nobody urgently tries to eliminate it. 

    When FX is classified as lost revenue, it becomes a treasury and commercial problem. The question changes from ‘how do we account for this’ to ‘why aren’t we collecting what we earned.’ That’s a conversation that reaches the CFO, the business owner, the pricing team. Costs get managed. Revenue gaps get hunted. 

    2. Measurement Changes 

    Costs are measured against budget. If your forex loss is within budget, it’s fine. 

    Revenue is measured against potential. If you earned USD 300,000 but only realized USD 288,000, that’s a USD 12,000 revenue gap. The question becomes: what would it take to close it? That’s a different kind of urgency. 

    3. Investment Calculus Changes 

    Organizations will invest in revenue growth far more readily than in cost reduction. If switching payment infrastructure saves USD 6,000 per year, it gets compared against setup friction, switching cost, and finance team time. Often the math doesn’t win. 

    If switching payment infrastructure recovers USD 6,000 in annual revenue that was always yours, that’s a different conversation. The money already existed. You just weren’t capturing it. 

    Where the Revenue Actually Goes 

    Let’s be specific. When an exporter sends a USD 50,000 invoice and ultimately receives INR equivalent to USD 48,200, the USD 1,800 gap is not random noise. It has a structure: 

    Revenue Gap Item Mechanism Typical Impact 
    FX spread at conversion Bank applies a rate less favorable than interbank market 0.5%–2.0% of amount 
    SWIFT correspondent deductions Intermediary banks deduct processing fees from your payment USD 15–45 per transaction 
    Settlement timing loss Payment sits idle in correspondent chain for 2–5 days Indirect, working capital cost 
    Value date gap Your account credited later than funds clear, affecting FX rate applied Variable 

    Each of these is a portion of revenue you created that didn’t survive the journey to your account. Not a cost you chose to incur. Not a service you’re receiving in exchange. Revenue that was earned but not captured. 

    How Realized Revenue Thinking Works in Practice 

    Businesses that treat FX as a revenue function — rather than a cost line — operate differently. Here’s what that looks like concretely. 

    • They measure realized rate per transaction, not just total INR received. On each payment, they know: what was the effective USD/INR rate we achieved? What would we have received at mid-market? The difference is tracked as realized revenue shortfall. 
    • They set a realized revenue target, not just an FX budget. Instead of ‘keep forex losses below 1.5% of receipts,’ they say ‘we should be realizing at minimum 98.5% of invoice value in INR equivalent.’ This shifts the frame from tolerance to expectation. 
    • They benchmark quarterly. Every three months, they review realized rate against the average mid-market rate for the same period. Consistent underperformance triggers action. 
    • They treat payment infrastructure as a revenue decision. When evaluating collection platforms, the question is not just ‘what does it cost’ but ‘what does it recover.’ A platform that charges a small fixed fee but offers transparent interbank FX pricing may recover significantly more revenue than a ‘free’ bank account with an opaque 1.5% spread. 

    The Numbers on a USD 25k+/Month Business 

    For an exporter collecting USD 300,000 per year: 

    Scenario Realized Rate vs Interbank Annual Revenue Captured Annual Revenue Gap
    Current state (typical SME bank) 98.0%–98.5% USD 294,000–295,500 USD 4,500–6,000 
    With optimized FX infrastructure 99.2%–99.5% USD 297,600–298,500 USD 1,500–2,400 
    Improvement in captured revenue ~1.0%–1.5% USD 2,100–4,500 additional — 

    That USD 2,100 to USD 4,500 annual improvement requires no additional sales, no new clients, no pricing change. It simply requires treating the revenue capture function with the same rigor as the revenue generation function. 

    The Bigger Shift: From Transaction Thinking to Treasury Thinking 

    The core of this reframing is a shift from seeing international payments as a series of individual transactions to seeing them as a continuous revenue stream that needs to be actively managed. 

    Transaction thinking asks: did the payment arrive? Treasury thinking asks: what percentage of the revenue we generated is actually reaching our INR account, consistently, predictably? 

    For businesses at the USD 25k/month threshold and above, this distinction becomes increasingly material. Growth amplifies inefficiency. If you’re losing 2% of revenue to FX at USD 300k annual collections, you’ll lose the same 2% at USD 3 million. But the absolute number is now USD 60,000 per year — and that’s material enough to change how you’ve built your entire payment infrastructure. 

    The businesses that grow their export operations most profitably are the ones that make this realization early, not after they’ve scaled the problem. 

    Frequently Asked Questions 

    What is the difference between FX cost and FX revenue loss? 

    FX cost refers to explicit charges (like transfer fees or conversion fees) that appear on statements. FX revenue loss is the invisible gap between what you invoiced and what you realized — caused by bank spread, intermediary deductions, and rate differences. The distinction matters because revenue loss requires different tools to measure and different decisions to address. 

    What is realized revenue for exporters? 

    Realized revenue is the INR equivalent you actually receive from your international collections, expressed as a percentage of your invoice value. If you invoice USD 100,000 and receive INR equivalent to USD 97,500, your realized revenue rate is 97.5%. Tracking this consistently is the foundation of FX optimization for exporters. 

    How do you calculate FX leakage? 

    Compare the INR you received for each USD transaction against the INR you would have received at the mid-market rate on the same date. The gap — expressed in INR and as a percentage of the transaction — is your FX leakage per transaction. Aggregated across all transactions in a period, this gives you total FX leakage. 

    Should FX loss appear in P&L as an operating cost? 

    Accounting standards require it to appear somewhere in the P&L. But strategically, treating it as an operating cost creates the wrong incentives. Businesses that reframe it as unrealized revenue tend to invest more in optimizing it — and capture significantly more of what they earned. 

    Who should own FX optimization in an export business? 

    In well-run exporting businesses, FX optimization sits at the intersection of treasury and finance leadership. It is not purely an accounting function and should not be delegated to whoever processes payments. At USD 25k+/month volumes, it warrants dedicated oversight and quarterly review. 

    Does switching to a different payment platform reduce FX leakage? 

    It depends on the platform’s FX pricing model. Platforms that offer live interbank rate pricing with transparent spread disclosure allow you to measure and minimize leakage. Platforms that apply opaque rates (similar to traditional banks) simply replicate the same problem in a different wrapper. The key question to ask any provider: what rate do I get, how is it determined, and what is the spread over mid-market? 

    Complete Guide to FX Optimization for Exporters | Xchangepe

  • CA Improves Client Experience & Reduces Follow-Ups with Xchangepe

    A Chartered Accountant managing multiple export clients across IT services and
    consulting was regularly dealing with client queries around inward remittances.
    From the CA’s perspective, the issues were repetitive and time-consuming:

    • Clients often complained that “INR received is less than expected”
    • Banks did not clearly disclose FX margins (1.5–2.5%)
    • Frequent follow-ups were needed for FIRA, IRM, and documentation
    • Each bank had a different process, making it hard to standardize
      This not only affected client satisfaction but also increased the CA’s operational
      workload.

    Xchangepe Solution:

    The CA introduced Xchangepe to a few clients initially to test the experience.

    • Transparent FX rates shown before conversion
    • Instant FIRA availability on dashboard
    • Faster settlements (T+1 or within hours)
    • All remittance details in one place

    Results and Benefits:

    • Significant reduction in client complaints around FX
    • Time saved on follow-ups with banks
    • Clients experienced better realization and faster credits
    • Improved client trust and long-term retention

    Conclusion

    For the CA, Xchangepe was not just a cost-saving tool but a way to deliver a smoother
    and more professional experience to clients—leading to stronger relationships and less
    operational stress.

  • Oil Exporter Improves Cash Flow During High-Volume Cycles

    A mid-sized oil exporter supplying to Southeast Asia and Middle East markets was
    handling large-ticket transactions regularly, with monthly inflows of ₹3–4 crore.While
    volumes were strong, the finance team faced ongoing challenges:

    • FX margins (~0.8–1%) quietly reducing overall realization
    • $40–$60 deductions on every transaction due to correspondent banks
    • INR credits taking 3–5 working days, affecting working capital cycles
    • Difficulty in planning payments to suppliers due to uncertain timelines
      Even small inefficiencies became significant due to the high transaction values.

    Xchangepe Solution:

    The exporter shifted collections to Xchangepe to improve efficiency and predictability.

    • Lower FX markup (~0.2%) with full transparency
    • No correspondent bank deductions
    • Faster settlements (same day / T+1)
    • Ability to track and manage all remittances digitally

    Results and Benefits:

    • Annual savings of ₹60+ Lakhs
    • Faster access to funds helped in better inventory and payment planning
    • Improved visibility on inflows and FX rates
    • Reduced dependency on bank coordination

    Conclusion

    For high-volume exporters, even small improvements in FX and
    settlement speed create a big impact. Xchangepe helped the exporter improve margins
    while bringing predictability to their cash flow.

  • Oil Exporter Improves Cash Flow During High-Volume Cycles

    A mid-sized oil exporter supplying to Southeast Asia and Middle East markets was
    handling large-ticket transactions regularly, with monthly inflows of ₹3–4 crore.While
    volumes were strong, the finance team faced ongoing challenges:

    • FX margins (~0.8–1%) quietly reducing overall realization
    • $40–$60 deductions on every transaction due to correspondent banks
    • INR credits taking 3–5 working days, affecting working capital cycles
    • Difficulty in planning payments to suppliers due to uncertain timelines
      Even small inefficiencies became significant due to the high transaction values.

    Xchangepe Solution:

    The exporter shifted collections to Xchangepe to improve efficiency and predictability.

    • Lower FX markup (~0.2%) with full transparency
    • No correspondent bank deductions
    • Faster settlements (same day / T+1)
    • Ability to track and manage all remittances digitally

    Results and Benefits:

    • Annual savings of ₹60+ Lakhs
    • Faster access to funds helped in better inventory and payment planning
    • Improved visibility on inflows and FX rates
    • Reduced dependency on bank coordination

    Conclusion

    For high-volume exporters, even small improvements in FX and
    settlement speed create a big impact. Xchangepe helped the exporter improve margins
    while bringing predictability to their cash flow.

  • CA Improves Client Experience & Reduces Follow-Ups with Xchangepe

    A Chartered Accountant managing multiple export clients across IT services and
    consulting was regularly dealing with client queries around inward remittances.
    From the CA’s perspective, the issues were repetitive and time-consuming:

    • Clients often complained that “INR received is less than expected”
    • Banks did not clearly disclose FX margins (1.5–2.5%)
    • Frequent follow-ups were needed for FIRA, IRM, and documentation
    • Each bank had a different process, making it hard to standardize
      This not only affected client satisfaction but also increased the CA’s operational
      workload.

    Xchangepe Solution:

    The CA introduced Xchangepe to a few clients initially to test the experience.

    • Transparent FX rates shown before conversion
    • Instant FIRA availability on dashboard
    • Faster settlements (T+1 or within hours)
    • All remittance details in one place

    Results and Benefits:

    • Significant reduction in client complaints around FX
    • Time saved on follow-ups with banks
    • Clients experienced better realization and faster credits
    • Improved client trust and long-term retention

    Conclusion

    For the CA, Xchangepe was not just a cost-saving tool but a way to deliver a smoother
    and more professional experience to clients—leading to stronger relationships and less
    operational stress.

  • Freelancer Gains Better Control Over Earnings with Xchangepe

    A Bangalore-based freelance performance marketer working with clients in the US and
    UK was receiving monthly payments of around $10,000–$15,000. While the work was
    consistent, the actual INR credited always felt lower than expected. Every month, the
    freelancer faced small but repeated issues that added up over time. Payments received
    via PayPal or bank transfers came with high FX margins (3–4%) Multiple deductions
    (platform fees + bank charges) made it difficult to track actual earnings Funds usually
    took 2–3 days to reflect, impacting personal cash flow No clear visibility on what rate
    was applied vs what was expected.Over time, this led to a constant feeling of “losing
    money somewhere” without clarity.
    Xchangepe Solution:
    After moving to Xchangepe, the freelancer started receiving payments via a USD virtual
    account.

    • Payments came in faster (same day / next day)
    • FX conversion was done at a fixed, transparent markup (~0.5%)
    • No hidden deductions, everything visible upfront
    • Could choose when to convert USD to INR, depending on rates

    Results and Benefits:

    • Savings of ~₹30,000–₹50,000 per month compared to earlier setup
    • Better clarity on actual earnings
    • Improved cash flow management
    • Less dependency on multiple platforms and follow-ups

    Conclusion:

    For freelancers, where margins directly impact personal income, Xchangepe helped
    bring clarity, control, and better realization—turning a confusing process into a
    predictable one.

  • Agri Exporter Streamlines FX Realisation andCompliance with Xchangepe

    A processed gherkin exporter supplying buyers across Europe and the Middle East was
    generating annual export revenues of ₹25–30 crore, with monthly realizations of ₹2–2.5
    crore across EUR, USD, and AED. While export volumes were strong, the exporter faced
    recurring challenges around FX conversion, settlement delays, and compliance
    coordination with their bank.
    Xchangepe’s realization analysis showed that the bank was effectively applying a 1% FX
    conversion margin, without offering any upfront rate transparency. Each inward
    remittance also attracted EUR 40 in correspondent bank charges, along with additional
    handling and processing fees. INR credits were typically delayed by 3–4 working days,
    affecting liquidity planning. Beyond costs, the exporter spent significant time following
    up with the bank for FIRA copies, which were required to generate IRM numbers and
    complete the BRC process—making compliance more manual than it needed to be.
    After routing export proceeds through Xchange.pe, the exporter experienced a clear
    shift in efficiency. FX conversions were executed at a transparent 0.35% markup over
    interbank rates, with zero correspondent and handling charges. INR credits were
    received on a T+1 basis, improving predictability and working capital management.
    Compliance processes were simplified significantly. FIRAs were instantly available on
    the dashboard and could be directly used for IRM generation, enabling smooth and
    timely BRC processing without repeated bank coordination. All compliance documents
    were stored centrally for easy access.

    Key Outcomes (Annualised):

    • FX savings: ₹18–20 Lakhs
    • Correspondent & handling charges eliminated: ₹3–4 Lakhs
    • Handling fee savings: ₹2.5 Lakhs
      Total annual savings of approximately ₹25–27 Lakhs, along with faster realizations and
      a much smoother compliance experience.
  • IT Services Exporter Improves FX Realisation withXchangepe

    An India-based IT and business support services exporter working with clients across
    the US and Europe was receiving foreign payments regularly through a leading private
    sector bank. With annual international inflows of around ₹12–15 crore across USD,
    EUR, GBP, and CAD, the company assumed its banking costs were “standard.” However,
    despite steady volumes, the finance team consistently noticed that the INR credited was
    lower than expected, with no clear explanation from the bank.
    A detailed FX and charges analysis conducted by Xchangepe revealed that the bank was
    effectively charging a 2.5% FX conversion margin over interbank rates, even though this
    margin was not mentioned anywhere in the credit advice or transaction statements. In
    addition, USD 30 per inward was being deducted as correspondent bank charges, along
    with routine handling and processing fees. All of these charges were further increased
    by 18% GST, while INR credits typically came in 3–4 working days after funds were
    received. With average monthly inflows of nearly USD 150,000, these hidden costs were
    quietly eroding margins and delaying cash flows.
    After moving its international collections to Xchangepe, the company saw an immediate
    improvement in both transparency and outcomes. Payments were converted at a fixed
    0.5% markup over interbank rates, with no correspondent or handling charges, and INR
    credits were consistently received on a T+1 basis. For the first time, the finance team
    could see the exact FX rate and charges before conversion, making reconciliation and
    forecasting far simpler.
    From a compliance perspective, operational friction was also removed. FIRA copies
    became instantly available on the Xchangepe dashboard, eliminating the need for
    repeated follow-ups with bank relationship managers. All remittance data and
    documents were available in one place, making audits and reporting effortless.

    Key Outcomes (Annualised):

    • FX margin savings: ₹21 Lakhs
    • Correspondent & handling charges eliminated: ₹3.5 Lakhs
    • Handling-related costs and taxes saved: ₹1.8 Lakhs
      Total annual savings of approximately ₹26 Lakhs, along with faster settlements and far
      better visibility into FX costs.